
When an activity combines an experiment, measurement, and logical reasoning, learning reaches a new level. In interdisciplinary science and math projects, students stop memorizing isolated formulas and start using numbers to explain real-world phenomena—from plant growth to water use, from data collection to graph interpretation.
This matters because the curriculum becomes meaningful when students see that calculation, observation, and investigation don’t belong in separate boxes. In practice, this kind of project boosts participation, data literacy, and decision-making.

Next, you’ll learn how to plan effective activities, which topics work best, where integration can fall short, and how to assess learning without turning the project into a pile of disconnected tasks.
The Essentials
- Real integration happens when math is used to measure, compare, predict, or explain—not just to “illustrate” a science lesson.
- Strong projects start with a question students can investigate, generate real data, and require interpretation—not just a poster or final presentation.
- The most productive topics often involve statistics, scale, proportion, volume, energy, biodiversity, and conscious consumption.
- An interdisciplinary project falls short when each subject is taught separately and everything is brought together only at the end for appearances.
- Assessment should consider the process, documentation, and reasoning—not just the finished product.
Interdisciplinary Science and Math Projects: What Changes When the Two Subjects Work Together
In technical terms, an interdisciplinary project is an approach that connects content from two or more subject areas to solve a problem, investigate a question, or create something with educational value. Put simply, it’s when science and math stop competing for class time and start supporting each other.
The goal isn’t to “mix everything together.” It’s to choose a situation that requires students to observe a phenomenon, collect data, organize results, and draw evidence-based conclusions. This approach is central to project-based learning and investigative tasks that call for reading tables and scales, working with percentages and averages, and comparing variables.
Where True Integration Happens
In practice, integration takes hold when math helps answer scientific questions. If students investigate evaporation, for example, they can use math to measure time, temperature, and volume. If the focus is recycling, they can work with graphs, proportions, and waste generation rates. When math becomes nothing more than a supporting calculation, the project loses its impact.
What sets a true interdisciplinary project apart from a series of parallel activities is its central question: it must require data, measurement, and interpretation at the same time.
Anyone who works in this area knows that the difference shows up in the planning. If a teacher starts by choosing the math content and then tries to “fit in” science, the result tends to feel artificial. When the question grows out of the phenomenon, everything comes together more naturally. For curriculum context, see Brazil’s Base Nacional Comum Curricular (National Common Core Curriculum), which organizes competencies and skills in an integrated way.
Topics That Work Best in the Classroom
Some topics make better projects because they generate measurable data and support different levels of complexity. Others produce attractive work but offer little in the way of investigation. The criterion is simple: the topic needs to lead to real observations and useful calculations.
Topics with Strong Potential
- School garden: plant growth, water volume, average germination rates, and comparisons between growing conditions.
- Energy use: reading utility bills, estimating costs, graphing usage, and discussing efficiency.
- Water quality: pH, turbidity, temperature, sample records, and interpreting results.
- Solid waste: sorting, weighing, percentages by category, and disposal rates.
- Climate and weather: daily data collection, averages, temperature ranges, and week-to-week comparisons.
What to Avoid with Less Effective Topics
When a topic relies only on opinions, it’s hard to create real integration. “Healthy eating,” for example, can make an excellent project—but only if students analyze food labels, measure serving sizes, calculate sugar content, and compare nutrients. Otherwise, it becomes a lecture in disguise. The same goes for “the environment”: without data, graphs, and a concrete question, the activity lacks depth.
IBGE, Brazil’s national statistics agency, is a useful source for putting consumption, population, and geography into context in school projects. A good place to start is its page of official statistics, especially when students need to connect community data with broader indicators.
How to Plan a Project Without Making It Up as You Go

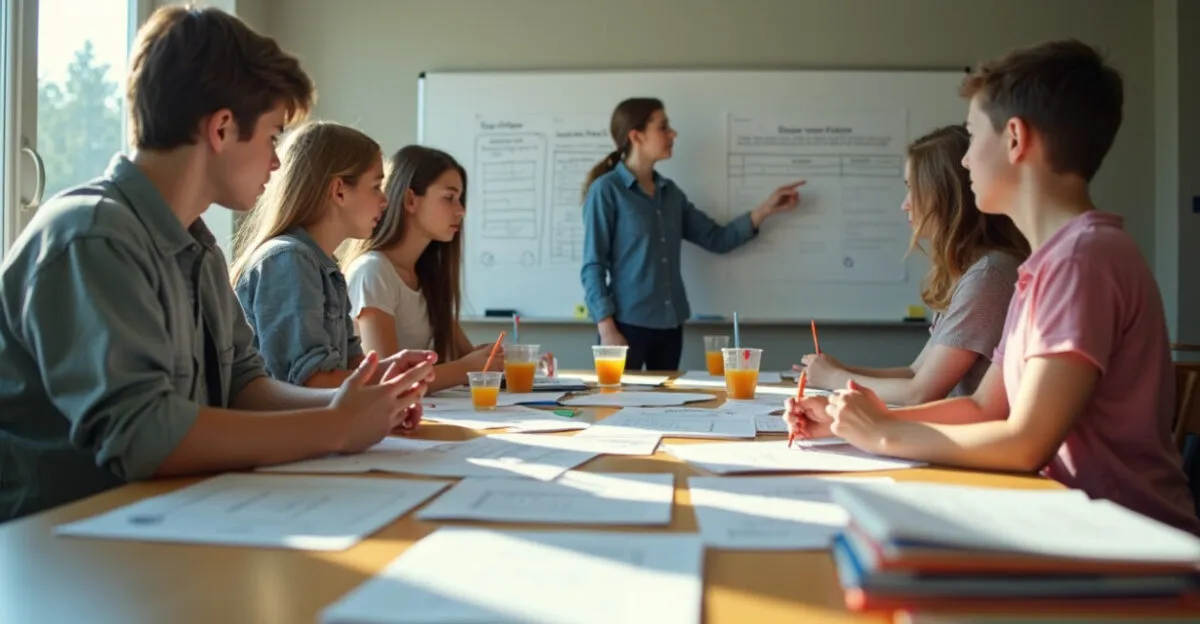
Good planning prevents the most common mistake: putting together an interesting activity that isn’t connected to clear goals. An interdisciplinary project needs a clear beginning, middle, and end. That doesn’t happen by accident.
Read also: Interdisciplinary School Projects: 6 Quick Models
A Practical Step-by-Step Guide
- Define a question students can investigate, such as “How does water use vary between two school routines?”
- Choose which data to collect: time, weight, volume, temperature, frequency, or quantity.
- Decide which format makes sense: a table, bar graph, line graph, or diagram.
- Determine what students will interpret in science and calculate in math.
- Choose a final product that depends on the analysis, not just its appearance.
A well-planned sequence keeps the project on track. For example, students can develop hypotheses in the first class, collect data in the second, organize results in the third, compare patterns in the fourth, and present conclusions in the fifth. This structure works well because it gives the project a clear rhythm and helps students see that investigation is a process.
In practice, a good project isn’t the one with the most steps; it’s the one that turns observations into data and data into an argument.
Real-World Examples
An elementary school investigated water waste at its drinking fountains. Students recorded peak usage times, measured how long faucets were left running, and compared records by class. Math came in through averages, tables, and graphs; science came in through discussions of natural resources, hygiene, and conservation.
Read also: Interdisciplinary Projects: How to Engage Your Class
A Classroom Story
In another class, students tracked the growth of bean plants in cups that received different amounts of light. At first, many thought all they had to do was draw the plant on a poster. It wasn’t until they collected weekly measurements that they noticed the plants grew very little during the first few days, then grew faster. That’s when the assignment stopped being a “fun activity” and became an exercise in interpreting patterns. That kind of shift can transform student engagement.
Projects can also make use of public data. For example, the INEP, Brazil’s national institute for educational studies and research, provides data that students can use to explore attendance, performance, and educational inequities in more advanced projects, as long as the teacher adapts the reading level to the grades involved.
Tools, Documentation, and Assessment That Make a Difference
The project improves significantly when documentation is treated as part of the learning process. A field notebook, simple spreadsheet, data collection form, and captioned photos can cover much of what’s needed. The problem is that many classes record information without a clear method and then try to “fix” the data at the end. That weakens the analysis.
What to Look for in Assessment
- Quality of the investigative question.
- Consistency between the data collected and the conclusions drawn.
- Correct use of units of measurement.
- Ability to interpret graphs and tables.
- Participation in the process and clarity of oral explanations.
Not every approach works the same way in every situation. In younger classes, a complex spreadsheet can get in the way more than it helps; in older classes, an overly open-ended record can become chaotic. The best tool is one students can use without losing sight of the investigation. If needed, simplify the format, but not the reasoning.
Common Mistakes That Undermine Interdisciplinary Learning
The most common mistake is turning science into a decorative theme and math into a mechanical calculation. The second pitfall is asking for a final product without building the thinking process behind it. The result is polished presentations and weak learning.
Recurring Pitfalls
- Combining content without a shared problem.
- Using math only at the end.
- Failing to teach students how to measure or record data correctly.
- Giving students complete freedom without criteria for analysis.
- Requiring slides before students understand the data.
Experts disagree about the ideal level of student autonomy. Some favor more open-ended projects; others prefer more structured guides, especially in the early grades. In a typical school setting, the safest approach is to adjust how open-ended the project is to the class’s maturity. Too much freedom without a method tends to create chaos. Too much structure without student ownership kills interest.
How to Adapt Projects for Different Age Groups
In the early grades, the priority should be observing, comparing, and recording with visual support. In later grades, students can work with proportions, percentages, scales, and more detailed data analysis. In high school, projects can include modeling, critical graph interpretation, and discussions of uncertainty.
Adapting by Grade Level
Grade level
Science focus
Math focus
Early grades
Observation and comparison
Counting, basic measurement, and tables
Later grades
Hypotheses and tracking variables
Averages, fractions, percentages, and graphs
High school
Understanding phenomena and critical analysis
Functions, scale, trends, and data interpretation
The best indicator of readiness isn’t how sophisticated the topic is, but how clearly the question, data, and conclusion connect. If students can explain why they took measurements, how they organized them, and what the results show, the project has met its educational purpose.
Next Steps for Putting It into Practice
If a school wants to move beyond superficial projects, the first step is to replace a “pretty topic” with a “good question.” Then, choose an observable phenomenon, decide how data will be collected, and make clear which math skill students will use to interpret the results. That’s the sequence that supports truly interdisciplinary science and math projects.
Before getting started, check three things: the question generates real data, math helps explain the phenomenon, and assessment measures reasoning—not decoration. Making these adjustments leads to more discussion, greater student ownership, and less improvisation. The next step is to choose a topic that matters to the class, create a data collection plan, and test the activity on a small scale before expanding it.
Frequently Asked Questions
What Makes a Science and Math Project Interdisciplinary?
A project is interdisciplinary when content from both subjects connects to answer a question, investigate a phenomenon, or analyze real data. Adding a calculation at the end of a science activity isn’t enough; math needs to contribute to building the explanation. In the classroom, this can involve measurements, graphs, proportions, estimates, and comparisons between variables. The key is that the subjects depend on each other, not simply that their topics appear together.
Which Topics Are Easiest to Explore This Way?
School gardens, water use, solid waste, weather, energy, and water quality are often a good fit because they generate measurable data. Students can collect information, organize it in tables, and draw evidence-based conclusions. Topics that allow repeated observations tend to make for more productive projects. Abstract topics can work, too, but they require more careful planning to keep the activity from becoming purely discussion-based.
How Can You Tell Whether Math Is Truly Part of the Project?
Math is genuinely integrated when it helps students measure, compare, predict, or support a conclusion. If the class only does a basic count or a final sum, the integration is weak. A good sign is that students need to interpret data to defend an idea. It’s also important to include units of measurement, visual representations, or calculations with a clear educational purpose—not just spreadsheet entries.
Can This Kind of Project Work with Younger Students?
Yes, as long as the instructions are more guided and the recording tools are simple. Young children can observe, sort, and compare with visual support, even without complex formulas. The key is to match the depth of the project to students’ development. Rather than expecting sophisticated analysis, focus on organized data collection, basic scientific vocabulary, and accessible ways to interpret results.
What Is the Biggest Mistake to Avoid When Planning Interdisciplinary Projects?
The biggest mistake is treating interdisciplinarity as decoration. When a teacher picks a topic, adds a calculation, and then asks for a poster, the project loses coherence. A strong project starts with a shared question and organizes science and math around it. Without that connection, the activity may look integrated on the surface but remain fragmented underneath.
Artigos Relacionados
 Interdisciplinary Projects in Elementary School: A Guide
 Science Projects Integrated Into the Elementary School Curriculum
 Interdisciplinary Projects for Elementary School
 6 Interdisciplinary Projects for Schools: Quick Models
 Fun First-Grade Math: Games, Activities, and Hands-On Ways to Explore Numbers, Shapes, and Logic
 Math Workshops: Hands-On Games for Understanding Concepts