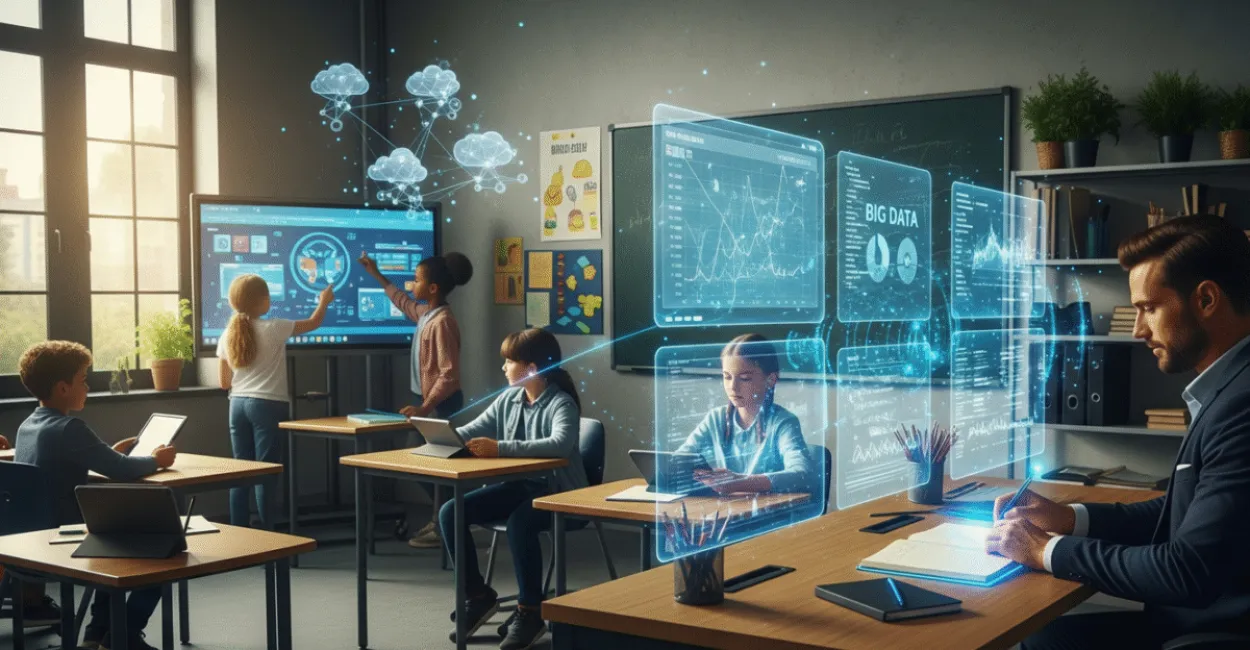
A platform records that a student watched a lesson, but it doesn’t show whether they understood the material. Big data in education brings together information from different sources to help institutions investigate questions like this and guide teaching decisions.
Its value depends on the quality of the analysis and the ability to turn findings into useful actions without collecting more information than necessary.
This work can help identify challenges, revise materials, and plan resources. It also involves risks: incomplete data can lead to incorrect conclusions, and predictions should never replace teachers’ judgment.
The starting point is to define which educational problem the institution wants to solve.
Key takeaways
- Educational big data combines information from different sources, formats, and time periods to investigate teaching and administrative questions.
- Grades and attendance, platform records, and open-ended responses can offer different insights into learning.
- Useful analysis connects each data point to a possible decision and a privacy safeguard.
- Institutions can start with a small project, evaluate its effects, and only then expand data collection or adopt additional tools.
What is big data in education?
Big data in education refers to the methods and technologies used to integrate and analyze large volumes of educational data produced in different formats and over time, in order to support teaching and administrative decisions. Put simply, it means looking for patterns in information that, on its own, doesn’t explain what is happening with students.
A spreadsheet of grades alone may show who performed poorly on a test. When linked with attendance, completed assignments, and activity in a virtual learning environment, it can help an institution form hypotheses about learning barriers. These hypotheses need to be checked against the context and discussed with students; they shouldn’t be treated as automatic diagnoses.
What are the three types of big data?
A common classification distinguishes structured, semi-structured, and unstructured data. It describes how information is organized, not its educational value.
- Structured: Follows defined fields, such as grades, attendance, age, or enrollment in a student information system.
- Semi-structured: Has some organization but doesn’t fit entirely into fixed tables; event logs and JSON files are examples.
- Unstructured: Doesn’t follow a standardized tabular format, such as forum posts, open-ended responses, audio, and video.
In education, this data can come from virtual learning environments, digital libraries, assessments, and administrative systems. Sensors and connected devices can also generate records, but they should only be used when there is a clear purpose and a reason to collect the information. The Internet of Things, for example, can record information about equipment or physical spaces, which calls for particular attention to privacy.
How is big data different from traditional data analysis in education?
Traditional analysis often works with smaller, more standardized datasets, such as a class’s grades in a spreadsheet. Big data can integrate sources, formats, and records produced on a larger scale. The difference isn’t just size: it also involves the variety and speed of the data and the infrastructure needed to process it.
An institution doesn’t need to adopt big data technologies to answer every teaching-related question. If a reliable spreadsheet can track attendance and help staff respond in time, a more complex system may add costs without improving the decision.
How data analysis supports teaching and learning
Analysis turns records into evidence that can guide action. The process typically involves four steps: collecting relevant data, checking and organizing it, analyzing patterns, and making a decision followed by an evaluation. If any step fails, a conclusion may seem precise without reflecting what is happening in the classroom.
Imagine a class gets a low score on a question about fractions. Before attributing the difficulty to an individual learning gap, the team can check whether the question was clear, compare responses with earlier activities, and talk with students. Classroom observations can help distinguish a conceptual challenge from an issue with access, timing, or understanding the instructions.
Educational analytics tools can organize attendance dashboards, track assignments, or highlight participation patterns. Data mining and machine learning methods look for regularities in large datasets; artificial intelligence can help with this work, but its results depend on the data used and require human review.
A login record, for example, doesn’t prove attention or learning. The distinction may seem simple, but overlooking it is a common mistake: institutions treat clicks as engagement and end up rewarding platform activity rather than understanding of the material.
Applications and benefits for educational institutions

Data can support decisions about personalized learning, monitoring challenges, and allocating resources. The table links potential goals to the minimum data needed and relevant safeguards; choices should start with a specific teaching-related question.
Read also: Starlink Global 2.0: Transforming High-Speed Internet Around the World
Educational goal Data needed Possible decision Privacy safeguard Identify barriers to learning specific content Responses by skill, activities, and teacher observations Review a concept or offer a different explanation Use data relevant to the goal and avoid labeling students permanently Monitor participation Attendance, assignments, and relevant interaction records Check with the student for barriers related to access or routine Don’t interpret a lack of clicks as a lack of interest Plan resources and schedules Enrollment, use of spaces, and course demand Adjust class offerings or equipment Use aggregated data whenever possible Evaluate a teaching intervention Results before and after, along with implementation context Continue, adapt, or discontinue the intervention Consider external factors and don’t claim causation without evidence
Personalized learning can mean offering review exercises to students who need them without lowering expectations or limiting a student’s path based on a prediction. Data can also help administrators identify courses with high demand and underused equipment. For these findings to improve teaching practices, teachers need to take part in interpreting the data and choosing what to do.
How to implement big data at an educational institution
Start with the decision that needs improvement, not with buying a tool. For example, a school that wants to identify learning challenges sooner should define what counts as a warning sign, who will follow up, and how it will know whether the intervention helped.
- Define the problem: Formulate a specific question, such as “Which students need additional support with this material?”
- Choose the minimum data needed: Identify available sources, the quality of the records, and any information gaps.
- Assign responsibilities: Involve educators, administrators, the technology team, and those responsible for privacy and security.
- Run a pilot: Apply the analysis to a specific group or process, with a defined timeline and evaluation criteria.
- Review the effects: Check whether the decision was useful, whether it had unintended effects, and whether the data still needs to be collected.
Tools can include student information systems, virtual learning environments, data visualization dashboards, and storage and analytics platforms. The choice depends on existing infrastructure, interoperability between systems, and the team’s ability to maintain the project. Systems professionals can support integration and security, while data professionals can help analyze and communicate the results.
To interpret data and apply these insights, the team needs to combine technical knowledge with an understanding of the school context. Data literacy helps people assess patterns, but teachers and administrators are needed to decide whether those patterns make sense for the class.
Privacy, ethics, and governance of educational data
Student data requires clear rules about purpose, access, retention, and security. In Brazil, the Lei Geral de Proteção de Dados Pessoais (LGPD), Brazil’s General Data Protection Law, sets out principles and obligations for processing personal data. Institutions should establish an appropriate legal basis for each use and clearly explain what they collect and why; consent isn’t a universal solution for every situation.
UNESCO’s Global Education Monitoring Report 2023: Technology in education: A tool on whose terms? examines the role of technology in education and asks who benefits from its use. This perspective matters for analytics projects: a tool may make monitoring easier while also increasing surveillance or inequality if used without limits and oversight.
The OECD Recommendation on Children in the Digital Environment also offers guidance on considering children’s rights and well-being in connected environments. Good practices at an institution include limiting access by role, protecting information from breaches, setting retention periods, and reviewing whether each piece of collected data still serves a purpose.
Bias is another risk. If students with unreliable internet access appear less active on a platform, a model may classify them as disengaged. Before using any prediction to direct support or make decisions about a student, the team should check which groups are affected, what data is missing, and how to challenge a classification.
Costs, challenges, and limits of adoption
There’s no single price for implementing data analytics at an institution. Costs depend on the volume and quality of the data, the tools purchased, infrastructure, system integration, security, and staff time. A pilot using resources already available may cost less than an institution-wide program involving new platforms, specialized storage, and hiring professionals.
The budget should also account for training, maintenance, and process reviews. A software license doesn’t guarantee that information is accurate or that anyone knows how to interpret it. Before purchasing a tool, an institution can take stock of what it already has, estimate recurring costs, and compare that expense with the expected value of the decision it wants to improve.
Some limitations can’t be solved with technology: incomplete records, differences between classes, and changes in context can alter observed patterns. Predictions should therefore prompt questions and checks, not determine someone’s academic future. If an institution can’t explain the purpose of collecting data or who will act on the results, it’s too soon to expand the project.
Data can help transform education when it supports well-founded teaching decisions. Tools such as augmented reality can also generate new usage records, but the presence of technology doesn’t prove that learning has taken place. The measure should be the educational outcome observed, not the volume of information produced.
Paulo Freire and the use of technology in education
It isn’t appropriate to attribute a specific position on big data or current technologies to Paulo Freire without a direct, reliable source. However, his work is often associated with valuing dialogue, autonomy, and students’ critical participation. Applying this perspective to data use means asking whether technology expands students’ ability to learn and participate or reduces them to profiles calculated by a system.
This question also helps evaluate how findings are communicated: students and families need to understand what an analysis indicates, what it can’t establish, and how to request a review of a decision.
A practical next step is to choose a specific teaching challenge and see whether the data already available can help investigate it. Document who will have access, what action might follow from the analysis, and how the institution will evaluate its effects. If there are no clear answers to these questions, additional data collection should wait.
Frequently asked questions
Can a small school use data analytics without a specialized platform?
Yes. For tracking a specific issue, a well-maintained spreadsheet may be enough. What matters is defining the question, protecting the records, and checking whether the analysis leads to a useful action.
Can data predict which students will fail?
Not with certainty. Analysis can identify patterns associated with challenges, but its results depend on data quality and each student’s context. Use warning signs to offer support and check the situation, never as a verdict or label.
How can you tell whether an educational analytics tool is right for you?
Find out what data it collects, where the data is stored, who can access it, and whether the institution can export or delete the information. Also request a demonstration tied to a real school decision; if the tool only displays charts without supporting a specific action, it may not solve the problem.
Artigos Relacionados
 Business Intelligence Analyst: How to Turn Data Into Winning Strategies
 Youth and Adult Education in Brazil: Better Preparation for a Successful Future
 Digital Education: Transforming Teaching with New Technologies
 Education and New Technologies: Transforming the Future of Teaching
 Augmented Reality in the Classroom: Turning Abstract Concepts Into Hands-On Experiences
 Environment and Education in the 21st Century: Pathways to a Sustainable Future